Feasibility of Measuring Micro-Differential Pressure and Flow Velocity Distribution inside Micro-electrochemical Devices Using Capillary Fiber Bragg Grating

We are currently conducting research and development and testing on Fluidized Electrode Capacitive Deionization (Feci) devices for water treatment applications. To validate the preliminary fluid simulation model, we need to in situ measure the flow rate differences in different regions within the device chamber and the pressure difference between the inlet and outlet.

After research, I plan to use multi-point Capillary Fiber Bragg Gratings (CapillaryFBG) to pass through the flowing brine chamber for stress/strain detection. Since our working conditions involve micro-pressure differences and low flow rates, I would like to consult your company’s technical experts to see if the current customized FBG products and supporting demodulators can meet the following measurement requirements:

Operating Conditions and Fluid Parameters

Fluid Chamber Dimensions: 40502mm

Fluid Medium: Low-concentration brine (1000mg/L NaCl) or a mixed liquid containing carbon particles (fluidized electrode slurry).

Flow Rate Range: Simulation results show that the high flow rate region is approximately 0.3m/s, and the low flow rate region (including dead zones) is approximately 0.05m/s.

Pressure Characteristics: The pressure gradually decreases from the inlet to the outlet. The total pressure difference between the inlet and outlet measured by simulation is only about 600Pa. (The pressure distribution is not completely consistent with the flow rate distribution; for example, the flow rate at the outlet may be high, but the pressure is the lowest in the chamber).

Preliminary Proposed Installation and Testing Plan

Fiber Arrangement: A multi-point customized CapillaryFBG will pass through the entire flowing fluid chamber horizontally or vertically.

Measurement Point Distribution: 3 measurement points (Gratings) will be arranged on one fiber, with a spacing of 15mm between adjacent points.

Measurement Logic: Measure flow rate difference: Rely on the different shear stress exerted by the fluid on the fiber surface in different regions (e.g., main channel and dead zone) to cause different center wavelength shifts in the FBGs at different positions, thereby inferring the flow rate distribution.

Measure overall pressure difference: Monitor the trend of internal stress changes in the device as the inlet flow rate/pressure increases.

Stress Measurement Sensitivity: For the flushing of liquids (even slurries containing carbon particles) in the low flow rate range of 0.05m/s to 0.3m/s, is the deformation caused by the force on the CapillaryFBG sufficient to cause a wavelength shift that can be effectively captured? Can the signal-to-noise ratio meet the requirements for distinguishing different flow rate regions?

Micro-pressure Difference Resolution: The maximum pressure difference between the inlet and outlet is only 600Pa. Can the customized fiber combined with the demodulator achieve precise demodulation of such small pressure changes?

Encapsulation and Interference: When FBG is subjected to lateral force, is there a problem of excessive attenuation in stress transmission? For the friction/flushing of carbon particles, what special coating treatment is required for the fiber surface?

Demodulator Recommendation: For the dynamic monitoring of the aforementioned micro-strain, what resolution (pm level) and sampling frequency demodulator are needed? Are there any recommended models?

We look forward to the answers and selection advice from the technical experts. If this plan is theoretically feasible, I would like to discuss customization details further. Thank you very much!


Hello, I am a pre-sales engineer from OFSCN. Regarding your idea of using Capillary FBG (Fiber Bragg Grating) for in-situ measurement of micro-flow velocity distribution and a 600Pa micro-pressure difference inside an FCDI device, from the perspectives of physical mechanics and fiber optic sensing, the feasibility of this scheme in a direct measurement mode is extremely low.

To help you clarify the technical feasibility and avoid R&D blind spots, I will provide a technical diagnosis from the following aspects:


I. Core Technical Bottleneck Diagnosis

1. Force deformation and signal-to-noise ratio issues at low flow rates (flow velocity measurement)

  • Extremely weak force: At low flow rates of 0.05\text{ m/s} \sim 0.3\text{ m/s}, the fluid (water or slurry with carbon particles) generates extremely weak vortex resistance (Drag Force) and surface shear stress on micro/millimeter-scale fibers (such as OFSCN® Thin-Diameter Fiber Bragg Gratings / FBG Strings (Bare) with 100μm outer diameter or millimeter-scale capillary sensors), typically in the micro-Newton (\mu\text{N}) range.
  • Wavelength shift below detection limit: If the fiber is directly across the 2\text{mm} flow channel and fixed at both ends, the deflection strain caused by lateral fluid buffeting may be below 0.1 \mu\epsilon, corresponding to a wavelength shift at the sub-picometer (sub-pm) level. The highest-end fiber Bragg grating demodulators currently have a resolution of typically 0.1\text{ pm}. At such a low signal-to-noise ratio, it is difficult to stably distinguish the difference between 0.05\text{ m/s} and 0.3\text{ m/s} against the background of flowing electrode slurry disturbance.

2. 600Pa micro-pressure difference cannot be directly perceived by optical fiber (pressure measurement)

  • Extremely low hydrostatic pressure sensitivity: The hydrostatic pressure sensitivity of bare fiber Bragg gratings is only about -3\text{ pm/MPa}.
  • Physical limits: 600\text{ Pa} is equivalent to only 0.0006\text{ MPa}. If the optical fiber is directly immersed in the fluid, the corresponding wavelength shift theoretically would be only about 1.8 \times 10^{-6}\text{ pm}, and no physical equipment can demodulate such a tiny signal.
  • Feasible alternative: To measure micro-pressure differences of this magnitude, pressure must be converted into macroscopic deformation of a diaphragm, and then indirectly measured by attaching a strain sensor (such as OFSCN® Alloy Tube Packaged Fiber Bragg Grating strain sensor) to the diaphragm.

3. Fatal temperature cross-sensitivity interference

  • Fiber Bragg gratings are naturally sensitive to temperature (typically 10\text{ pm/}^\circ\text{C}).
  • During electrochemical reactions or pumping in an FCDI device, the fluid temperature is prone to perturbations of 0.1^\circ\text{C} or even higher. This perturbation will cause a wavelength shift of about 1\text{ pm}, which will completely drown out the weak strain signals generated by flow velocity and micro-pressure difference.

II. Guided Questions (Seeking Alternative and Optimization Feasibility)

To help you assess whether this test can be achieved through structural design (such as introducing a cantilever target plate, micro-diaphragm, or temperature compensation mechanism), we need to confirm the following 2 key technical design questions:

  1. Structural conversion design: Have you considered designing a mechanical amplification structure for the FBG within the cavity? (For example: pasting the optical fiber onto a miniature cantilever beam/target plate to amplify the fluid impact force, or pasting the optical fiber onto a thin diaphragm at the inlet/outlet to measure the diaphragm deformation caused by pressure, rather than having the optical fiber subjected to direct tensile force in the fluid?)
  2. Temperature compensation scheme: Due to significant temperature interference, have you reserved space in the 40\times50\times2\text{mm} micro-cavity for a reference grating that is completely free from stress and only senses temperature (such as an ultra-thin temperature probe like OFSCN® 100°C Fiber Bragg Grating Temperature Sensor) for real-time temperature compensation?

You can click the links above to view the physical dimensions and technical parameters of standard sensors. We look forward to your feedback, and we will discuss the feasibility of further customization based on your specific installation structure.

Hello! Thank you very much to your company’s pre-sales engineers for such professional and detailed physical mechanics and optical diagnostics. Your analysis was very accurate and directly dispelled our misconception of blindly conducting bare fiber testing.

In response to your proposed structural transformation design and temperature compensation scheme, considering the narrow cavity of our FCDI device (only 2mm thick) and the special working condition where the fluid is a “carbon particle slurry”, we have re-envisioned the experimental scheme. We hope to further discuss with your company the feasibility of implementing the following modification plan and the selection of standard sensors:

1. Regarding Flow Rate Measurement

Since the force on the bare optical fiber is extremely weak at low flow rates, we consider using a micro-cantilever beam (or a highly elastic PI windward thin film) as a mechanical amplification medium within the 2mm thick flow channel, with the optical fiber attached to the root of the beam.

Parameter Supplement: The fluid in the FCDI cavity is not pure water, but a slurry rich in carbon particles, with a higher density and apparent viscosity than pure water. At flow rates of 0.05~0.3m/s, the drag force of the slurry on the target plate will be greater than that of pure water.

Inquiry: What are the allowable bending radius and limit strain of your OFSCN® 100μm outer diameter ultra-fine fiber grating (Bare)? If we adhere this ultra-fine optical fiber to the root of a micro-cantilever beam, will it be sufficient to capture the bending deformation caused by the slurry impacting the target plate? Are there any similar past cases?

2. Regarding Pressure/Differential Pressure Measurement (External Strain Measurement Scheme for Micro-Diaphragm)

600Pa cannot be directly sensed by the bare optical fiber. We plan to adjust the scheme by creating “micro-pressure windows” on the solid walls of the inlet and outlet of the device, encapsulating a highly elastic micro-diaphragm (e.g., micrometer-scale stainless steel or highly elastic polymer film), and converting the pressure into tensile strain of the diaphragm.

Inquiry: For this requirement of measuring micro-strain on the diaphragm surface, what are the physical dimensions (especially thickness and length) of the “alloy tube encapsulated strain sensor” mentioned by your company? Can it be adhered to a micro-circular diaphragm? If there is insufficient space due to the 2mm cavity limitation, will using a bare fiber grating directly bonded with adhesive to the diaphragm achieve higher strain sensitivity?

3. Regarding In-situ Temperature Compensation Scheme (Dual Grating Differential)

At the 3 measurement points with a 15mm spacing, we plan to adopt a dual-fiber parallel or single-fiber dual-grating scheme:

At each measurement point, one optical fiber for strain measurement will be deployed, along with one OFSCN® ultra-fine temperature probe sleeved inside a capillary tube, completely free from force. The reference grating will be used for real-time absolute temperature subtraction.

Inquiry: Can you provide a customized “integrated probe”, i.e., integrating 3 measurement points within one capillary tube, with each measurement point simultaneously containing “one strained grating + one suspended temperature compensation grating”? This would ensure that only one composite capillary tube needs to pass through the 2mm slit.

We look forward to in-depth discussions with your technical team regarding the feasibility of integrating the aforementioned miniaturized structures (cantilever beam/micro-diaphragm) with optical fibers. If your company has any past cases of similar micro-strain and micro-flow rate testing, please also share them. Thank you!

Hello! We are very pleased to see the rigorous and scientific engineering exploration spirit demonstrated by you and your R&D team. Your proposed upgrade design schemes of “cantilever beam/target plate flow velocity conversion” and “micro-pressure window thin film pressure conversion” are completely correct in terms of physical and mechanical principles, and are also very classic engineering transformation ideas for the application of Fiber Bragg Gratings in micro and extreme conditions.

Regarding the three technical directions you have re-envisioned, I provide the following professional technical answers and scheme analysis:


I. Feasibility Analysis of Technical Aspects Item by Item

1. Regarding Flow Velocity Measurement: Mechanical Limits and Application of 100μm Thin-Diameter Gratings

  • Usable Limit Strain:
    Standard OFSCN® Thin-Diameter Fiber Bragg Gratings / FBG Strings (Bare) are point-by-point written using femtosecond laser, which does not damage the polyimide (PI) coating of the optical fiber. The usable strain range at room temperature can reach \le 15000\,\mu\epsilon. If you require higher tensile strength, you can consider OFSCN® High-Strength Fiber Bragg Gratings / FBG Strings (Bare) (using screened high-strength single-mode polyimide fiber, with a usable strain range of \ge 25000\,\mu\epsilon, but its diameter is 155\,\mu\text{m}).
  • Allowable Bending Radius:
    The OFSCN® Small diameter optical fiber used in OFSCN® Thin-Diameter Fiber Bragg Gratings / FBG Strings (Bare) has an extremely small physical size with a cladding diameter of 80\,\mu\text{m} and a coating diameter of 100\,\mu\text{m}. Its bending performance is far superior to traditional 125\,\mu\text{m} fibers. Under short-term static bending, the bending radius can be as low as 5\text{ mm}, while the long-term reliable bending radius is recommended to be above 10\text{ mm} \sim 15\text{ mm}. Within this range, significant macro-bending loss or mechanical fracture will not occur.
  • Feasibility:
    It is entirely feasible to adhere the thin-diameter grating to the root of a micro-cantilever beam (e.g., PI film). Due to the significantly higher viscosity and density of the carbon particle slurry compared to pure water, the resistance generated by the slurry acting on the cantilever beam at 0.05 \sim 0.3\text{ m/s} will increase considerably. The local bending strain at the root of the cantilever beam is sufficient to be accurately captured by the 100\,\mu\text{m} thin-diameter grating.

2. Regarding Pressure/Differential Pressure Measurement: Alloy Tube Packaging vs. Bare Grating Surface Mounting

  • Physical Limitations of Alloy Tube Sensors:
    The default outer diameter of OFSCN® Alloy Tube Packaged Fiber Bragg Grating strain sensor is \le 1.1\text{ mm}. Although the thickness can accommodate a 2\text{ mm} cavity, the factory calibrated default custom range for the length of a single strain measurement segment is 10\text{ cm} \sim 2\text{ m}.

    (The image below is a reference for the physical appearance of alloy tube strain sensors:)

    Since the overall chamber size of your FCDI device is only 40 \times 50\text{ mm}, and the diameter of the “micro-pressure window” diaphragm at the inlet and outlet is typically only a few millimeters, it is physically impossible to mount the alloy tube package due to space constraints.

  • Advantages of Bare Grating Mounting:
    In your working conditions, directly bonding the bare fiber Bragg grating to the diaphragm with adhesive is the optimal solution. Without the obstruction of the alloy tube’s own stiffness to the film’s deformation, the tiny deformation of the film can be transmitted to the core of the bare grating with extremely high efficiency, thus achieving a strain sensitivity far superior to that of tube packaging.

3. Regarding In-situ Temperature Compensation: Mechanical Conflict of “Integrated Composite Capillary Tube”

  • Process Feasibility:
    Technically, it is feasible to encapsulate two thin-diameter optical fibers (one fixed to the inner wall for strain measurement, and one suspended for temperature measurement) within a single stainless steel or quartz capillary tube with an outer diameter of approximately 0.5 \sim 1.0\text{ mm}, and to create 3 measurement points within one tube during manufacturing.
  • Structural Mechanical Conflict (Key Bottleneck):
    Since you need to measure the “flow velocity distribution” and “pressure gradient” in space using 3 independent cantilever beams or diaphragms, if a single continuous metal or quartz capillary tube with a certain bending stiffness spans all 3 measurement points, the capillary tube itself will become a strong constraint beam, forcibly and physically coupling the 3 cantilever beams/diaphragms that should deform independently. This will cause the deformation caused by the force on point 1 to be transmitted to point 2 through the capillary tube, resulting in severe signal crosstalk, making it impossible to distinguish the true local spatial distribution.

II. Guided Questions

To mitigate the risks associated with mechanical coupling and material erosion, we need to further confirm the following 2 key technical structural issues with you:

  1. Physical Decoupling of Measurement Points: To avoid mechanical coupling caused by a single composite capillary tube, can you consider abandoning the single贯穿 (penetrating) design and instead use 3 independent micro-capillary probe leads? For example: each measurement point uses 1 ultra-thin temperature sensor with an outer diameter as low as 0.6\text{ mm} (such as a customized ultra-thin version of OFSCN® 100°C Fiber Bragg Grating Temperature Sensor) to provide temperature reference, while the strain-measuring grating is independently surface-mounted on the corresponding cantilever beam or diaphragm using bare fiber, achieving complete physical isolation in space?

    (The image below is a reference for the ultra-thin temperature compensation sensor with a default outer diameter of 0.9\text{ mm} and a customizable outer diameter of 0.6\text{ mm}):

  2. Erosion Protection for Carbon Particle Slurry: Since the flow electrode slurry contains abrasive carbon particles, after the bare fiber is mounted on the cantilever beam or diaphragm, it will be directly exposed to the slurry’s scouring environment. Do you require us to customize polyimide (PI) recoating on the surface of the bare grating, or to consider adding a layer of elastic protective coating (such as anti-scouring fluoroelastomer) in your mounting process?

We look forward to your feedback. Based on your spatial constraints and decoupling requirements, we can further discuss the customized parameters for bare fiber strings and micro-temperature compensation probes.

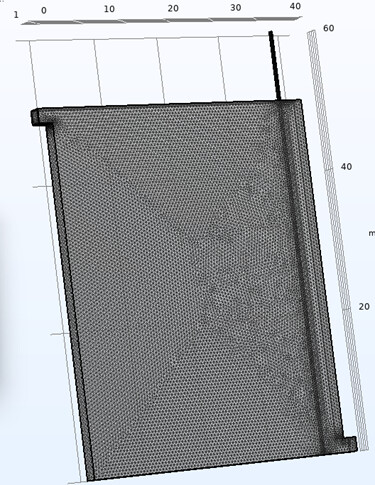
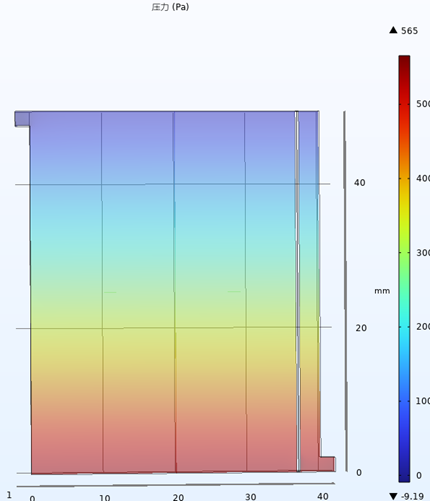
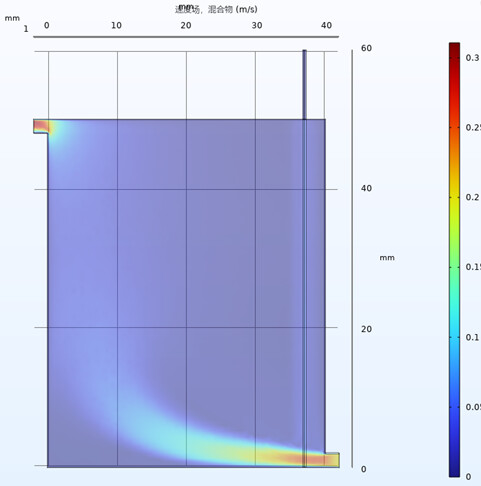
Hello, here are images from my simulation modeling. Please advise on how to modify the device installation of optical fibers to achieve my measurement goals. The images below show 3D modeling, pressure distribution, and velocity field distribution, respectively. My objective is to measure the difference between high-flow-velocity and low-flow-velocity regions, as well as the difference between high-pressure and low-pressure regions.

Hello! Thank you very much for sharing such an intuitive and detailed COMSOL finite element simulation image.

Through your simulation results, we can clearly see the characteristics of the physical field distribution inside the chamber of this FCDI device (40 \times 50 \times 2\text{ mm}):

  1. Velocity Field (Image 3): The fluid exhibits a very obvious “diagonal convection channel” characteristic. A high-speed jet stream (red/yellow area, flow velocity up to 0.3\text{ m/s}) is formed from the inlet in the lower right corner to the outlet in the upper left corner; while the upper right and lower left corners are typical stagnant flow zones (dark blue area, flow velocity \le 0.05\text{ m/s}).
  2. Pressure Field (Image 2): The pressure gradually attenuates diagonally from the inlet in the lower right corner (red area, maximum approximately 565\text{ Pa}) to the outlet in the upper left corner (blue area, minimum approximately -9.19\text{ Pa}), with an overall maximum pressure difference of about 570\text{ Pa}.

Considering the extremely micro-scale cavity conditions and slurry flow characteristics, to help you successfully achieve your research goals of “measuring high and low flow velocity differences” and “measuring the trend of inlet and outlet pressure differences,” I have compiled a set of specific engineering solutions for “Micro-Structure Modification and Fiber Optic Integration”:


I. Device Modification and Fiber Optic Installation Scheme Recommendation

1. Flow Velocity Distribution Measurement: Multi-point Cantilever Beam/Target Plate Shear Strain Design

To distinguish the flow velocity differences between the main channel (0.3\text{ m/s}) and the stagnant zones (0.05\text{ m/s}) within a narrow flow channel of 2\text{ mm} thickness, directly spanning a straight fiber optic will not be effective.

  • Device Modification:
    It is recommended to vertically insert 2 micro-cantilever beams (or highly elastic PI windward thin films) from specific coordinates on the chamber’s cover plate. The suggested thickness of the thin films is around 50\ \mu\text{m} \sim 100\ \mu\text{m}:
    • Measurement Point A (High Velocity Point): Positioned on the trajectory of the jet stream from the inlet in the lower right corner or the outlet in the upper left corner.
    • Measurement Point B (Low Velocity Point): Located in the stagnant flow zone (dark blue static zone) in the upper right or lower left corner.
  • Fiber Optic Installation:
    Adhere one OFSCN® Thin-Diameter Fiber Bragg Gratings / FBG Strings (Bare) (thin bare fiber Bragg grating string with a 100\ \mu\text{m} outer diameter) to the root of the cantilever beam using high-elasticity adhesive. When the slurry flows and impacts the cantilever beam, the resistance-induced bending deformation will directly translate into tensile/compressive strain on the grating. Due to the high density and viscosity of the slurry, the resistance at a flow velocity of 0.3\text{ m/s} is sufficient to cause tens of \mu\epsilon strain at the root of the micro-cantilever beam, thereby obtaining a wavelength drift signal with extremely high signal-to-noise ratio on the demodulator.
  • Product Selection:
    If higher tensile mechanical strength is required to withstand the long-term erosion and wear from carbon particles, you can also opt for OFSCN® High-Strength Fiber Bragg Gratings / FBG Strings (Bare) (selected 155\ \mu\text{m} outer diameter high-strength bare gratings, tensile strain range \ge 25000\,\mu\epsilon).
    (The image below is a reference image of the high-strength bare grating product:)

2. Micro Pressure Difference Measurement: Solid Wall External “Micro-Pressure Window” Diaphragm Design

Since the maximum pressure difference within the device is only \Delta P \approx 570\text{ Pa} (approximately 0.00057\text{ MPa}), which is an extremely weak pressure, it must be mechanically amplified through structural design.

  • Device Modification:
    On the solid walls of the FCDI device, specifically in the lower right corner (high-pressure zone, near the inlet) and the upper left corner (low-pressure zone, near the outlet), respectively, create circular “micro-pressure measurement windows” with a diameter of approximately 5\text{ mm} \sim 8\text{ mm}. Then, encapsulate a highly elastic metal diaphragm (e.g., a 20\ \mu\text{m} thick stainless steel diaphragm) or a polymer elastic diaphragm (e.g., PDMS membrane) over the window.
  • Fiber Optic Installation:
    Pre-stretch the bare grating string OFSCN® Thin-Diameter Fiber Bragg Gratings / FBG Strings (Bare) and adhere it across the center of the outer side of the diaphragm using elastic adhesive. When the pressure inside the chamber fluctuates, the diaphragm bulges and deforms, directly stretching the fiber Bragg grating. This method converts the weak pressure into significant axial strain, allowing for easy detection of tiny pressure changes of hundreds of Pascals.

3. Real-time In-situ Temperature Compensation: Decoupled Temperature Compensation Probe

Due to temperature increases caused by slurry flow friction and electrochemical reactions, temperature drift must be compensated for to avoid interfering with the extremely weak strain signals mentioned above.

  • Installation Method:
    Since a single capillary tube passing through can cause mechanical stiffness coupling, we recommend physically separating the strain-measuring grating (directly attached to the cantilever beam or diaphragm) from the temperature-measuring grating in space.
    Drill a separate hole in the chamber wall to introduce an ultra-fine reference probe that is completely free from stress and only senses temperature. This probe will be used for real-time fluid temperature acquisition and differential subtraction.
  • Product Selection:
    It is recommended to use a custom ultra-fine version of the OFSCN® 100°C Fiber Bragg Grating Temperature Sensor (outer diameter can be as low as 0.6\text{ mm}, encapsulated in seamless stainless steel tubing). This outer diameter can easily accommodate your 2\text{ mm} chamber channel and possesses extremely strong resistance to flushing.
    (The image below is a physical reference of the standard 0.9\text{ mm} outer diameter, customizable to a minimum of 0.6\text{ mm} outer diameter, ultra-fine temperature sensor:)

II. Technical Diagnosis Summary

By adding “local micro-cantilever beams (for measuring flow velocity differences)” + “wall micro-diaphragm windows (for measuring pressure differences)” + “decoupled ultra-fine temperature compensation probes”, your FCDI device can perfectly avoid the blind spots caused by the extremely weak direct force on the fiber optics and the mutual coupling of physical signals.

You can click on the links above to view detailed technical parameters. Please feel free to discuss any specific technical questions.