How can several years of historical data be saved and analyzed for trends?
To save fiber sensing (such as Fiber Bragg Grating FBG sensing systems) historical data for many years and effectively perform trend analysis, engineering design is required at four levels: data source reduction, storage architecture design, system integration, and data mining algorithms:
1. Data Source Reduction and Downsampling (Data Reduction)
Fiber Bragg grating interrogators typically have high sampling frequencies during acquisition (e.g., 10\text{ Hz}, 50\text{ Hz}, or 100\text{ Hz}). Continuous acquisition for many years at 100\text{ Hz} would generate an extremely large amount of data for a single measurement point. For long-term Structural Health Monitoring (SHM) or environmental monitoring, millisecond-level dynamic response is usually not required.
- Software Downsampling: Reduce the sampling frequency in the edge device or interrogator software (e.g., to 1\text{ Hz} or once per minute).
- Feature Extraction and Event Triggering: Normally save only the mean, maximum, minimum, and standard deviation; when a sudden change is detected or a set threshold is exceeded, trigger full acquisition of high-frequency raw waveforms.
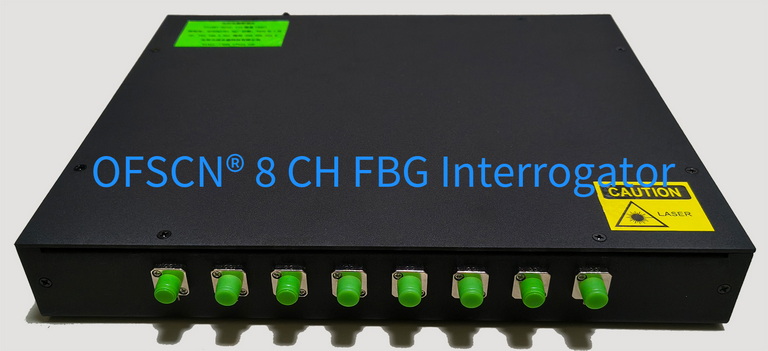
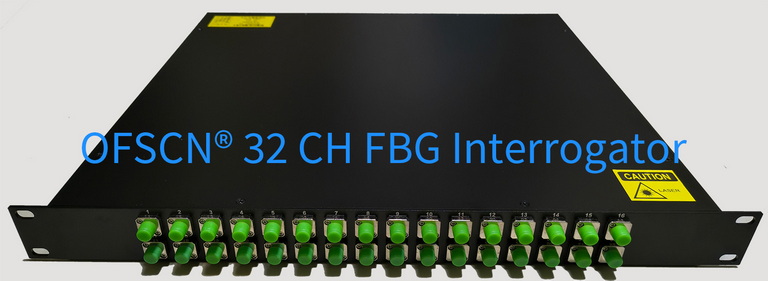
The OFSCN® Fiber Bragg Grating Interrogator offers optional default data sampling frequencies of 10\text{ Hz}, 50\text{ Hz}, and 100\text{ Hz}. Users can independently lower the sampling frequency (down to 1\text{ Hz}) through the interrogator’s accompanying software, significantly reducing the storage burden of historical data at the source.
2. Time-Series Database and Tiered Storage Architecture (Storage Architecture)
Long-term historical data storage typically employs specialized industrial-grade storage architectures:
- Time-Series Database (TSDB): Utilize databases suited for time-series data (e.g., InfluxDB, TDengine, or TimescaleDB). TSDBs offer extremely high data compression ratios (over 1:10) and efficient time-range query capabilities.
- Hot/Cold Data Tiered Storage:
- Hot Data (Recent 1-3 months): Stored in high-performance SSDs or in-memory databases for real-time monitoring, alerting, and recent trend viewing.
- Cold Data (Historical data from several years ago): After high-ratio lossless compression, transferred to low-cost cloud object storage (e.g., OSS / S3) or offline storage arrays.
3. Data Transmission and System Integration (System Integration)
Saving data to cloud platforms or local central databases requires flexible network transmission interfaces from the interrogator device.
The OFSCN® Fiber Bragg Grating Interrogator uses B/S architecture software by default, also supports C/S architecture software, and can integrate with user-built cloud platforms, databases, and SCADA systems via protocols such as TCP, UDP, and Modbus, ensuring stable upload of historical wavelength and physical quantity data.
4. Trend Analysis Methods for Cross-Year Historical Data (Trend Analysis)
After obtaining long-term physical quantity data, the main steps for trend analysis include:
- Accurate Physical Quantity Conversion: Use the sensor’s factory calibration formula (linear or quadratic polynomial) to convert wavelength drift \Delta\lambda into accurate strain ( \mu\varepsilon ), temperature ( {}^\circ\text{C} ), or stress values.
- Environmental Factor Decoupling (Temperature Compensation and Denoising): Long-term monitoring data contains periodic fluctuations caused by distinct seasonal and diurnal changes. Temperature compensation algorithms or signal decomposition methods (such as moving average filtering, wavelet transform, or Seasonal-Trend decomposition using Loess (STL) algorithm) are needed to differentiate periodic thermal expansion/contraction from genuine long-term structural creep or damage.
- Statistical and Regression Modeling: Employ linear/non-linear regression, sliding percentiles, or machine learning models to fit the baseline trend after removing environmental noise, predict the structure’s evolution trend over the next few years, and set warning thresholds.