If the on-site situation cannot be resolved, can OFSCN® experts remotely view my spectrum data?
Yes. In the event of engineering or measurement anomalies on-site, OFSCN® technical experts can remotely view and analyze your spectrograms and sensor data in real-time.
This support capability is enabled by the network software architecture design of the Fiber Bragg Grating Interrogator and common remote collaboration methods:
I. Methods for Remotely Viewing Spectrograms
-
Native Remote Web Access via B/S Architecture
The OFSCN® Fiber Bragg Grating Interrogator employs a B/S (Browser/Server) architecture software by default. The interrogator integrates an independent data processing system and a Web service engine:- By connecting the interrogator to the site network and granting network access permissions through LAN mapping, intranet penetration, or VPN assignment, remote engineers can log in directly to the interrogator’s management interface using a standard web browser without needing to install any client software.
- Experts can remotely view the complete spectral curve across the entire band (defaulting to 1525 \sim 1565\text{ nm} or 1528 \sim 1568\text{ nm} ), along with the peak wavelength, optical power, and signal-to-noise ratio for each channel in real-time.
-
Remote Desktop and Real-time Screen Sharing
For sites deployed within closed industrial intranets or strictly secured isolated areas, synchronous troubleshooting can be performed by sharing the interrogator’s interface and spectral windows with experts using secure remote desktop tools (such as TeamViewer, AnyDesk, etc.) via a connected industrial control computer/laptop on-site. -
Export of Raw Spectral Data and Wavelength Sequences
The interrogator software supports saving and exporting raw spectral scan data files and wavelength logs. If the site is completely offline and disconnected from the network, on-site personnel can save the spectral data or screenshots under the current abnormal conditions and send them to the experts. The technical staff can then perform reverse analysis of the physical characteristics based on this data.
II. What Typical On-Site Issues Can Experts Diagnose Through Spectrograms?
The reflection spectrum morphology of Fiber Bragg Gratings (FBGs) directly reflects the optical and mechanical state of the sensor. By remotely analyzing the reflection peaks, the following issues can typically be precisely located:
- Connector Cleanliness and Link Attenuation Issues: If the overall channel baseline noise increases, or the reflection peak amplitude significantly decreases or falls below the demodulation threshold, it usually indicates contamination or wear on the fiber optic connectors (e.g., FC/APC end faces), macro-bending losses due to excessively small fiber bend radius, or exceeding splice loss limits.
- Non-uniform Stress and Localized Compression: A normal Fiber Bragg Grating exhibits a symmetrical single-peak morphology. If the reflection spectrum shows double peaks, split multiple peaks, broadening, or severe asymmetry, it typically indicates that the sensor experienced non-axial shear stress, local lateral pressure, or uneven curing stress during installation and fixation, leading to chirp.
- Exceeded Range or Optical Path Breakage: If the wavelength for a corresponding channel completely disappears, observing the baseline flatness and light source emission level can help determine whether the sensor’s measurement point wavelength has exceeded the system’s physical scanning range or if the optical cable has been mechanically severed.
Related Equipment
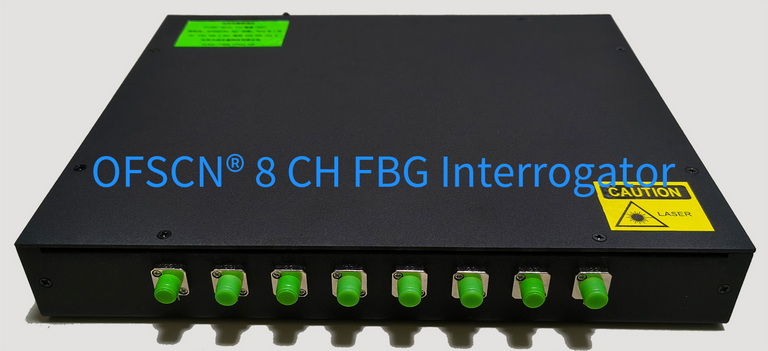
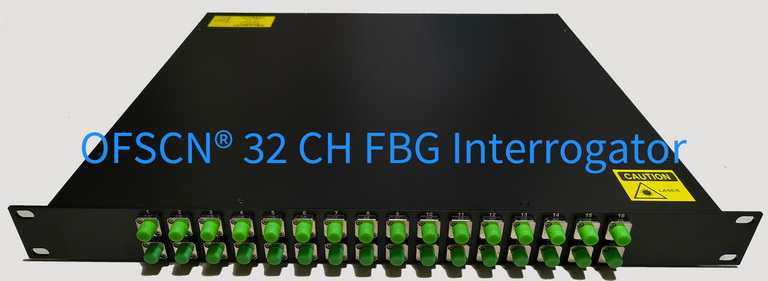
- Official Detailed Specifications and Features: OFSCN® Fiber Bragg Grating Interrogator