When the signal is very weak, does the software report an error or randomly guess a number?
In Fiber Bragg Grating (FBG) demodulation systems, industrial-grade interrogators do not “randomly guess a number” when the optical signal is very weak. Mature demodulation algorithms possess comprehensive signal judgment and fault tolerance mechanisms; when the reflected signal strength falls below an available threshold, the software will explicitly report an error, indicate “No Signal / Loss of Lock,” or output an invalid data marker (e.g., NaN).
Only when the algorithm design is rudimentary, lacks robustness, or the user has not set a power threshold gate may the software misinterpret random glitches in the background noise as grating reflection peaks, thereby producing data with drastic jumps.
I. What is “Robustness of Peak-Finding Algorithms”?
The reflection spectrum of a Fiber Bragg Grating typically approximates a Gaussian or quasi-Gaussian line shape. The core task of the demodulator is to calculate the central reflection wavelength \lambda_B from the discretely sampled spectral intensity sequence using a peak-finding algorithm (such as centroid method, nonlinear Gaussian fit, cubic polynomial fit, extremum search, etc.).
The “Robustness” of a peak-finding algorithm refers to its ability to maintain demodulation stability, wavelength accuracy, and avoid divergence or misjudgment when faced with various adverse optical signal degradations and external disturbances. The main interfering factors include:
- Extremely Weak Signals and Low SNR (Low SNR): Long-distance transmission loss, fiber micro-bending, excessive splicing loss, or dirty connectors can cause reflection power attenuation of 10\sim 30\text{ dB} or even more, bringing the signal close to the detector’s background noise.
- Background Noise and Shot Noise: Photodetector dark current, amplifier thermal noise, and the source’s Relative Intensity Noise (RIN) can produce high-frequency random spikes on the spectrum.
- Spectral Distortion and Double-Peaked Phenomena: When an FBG is subjected to non-uniform strain, transverse shear stress, or birefringence, the reflection peak may broaden, become asymmetric, or even split into multiple peaks.
- Side-lobe Interference: Side-lobe reflections introduced during grating fabrication, if having low SNR, can be easily mistaken for the main peak.
An algorithm with high robustness can accurately distinguish between “true grating reflection peaks” and “noise/spurious peaks” under the above non-ideal operating conditions.
II. Software’s Underlying Judgment Logic for Weak Signals
To prevent “randomly guessing numbers” during weak signal or fiber break scenarios, industrial-grade demodulation systems typically employ multi-level filtering and judgment logic:
1. Amplitude Threshold and SNR Threshold Detection
Demodulation software usually sets an absolute optical power threshold or a relative signal-to-noise ratio (SNR) threshold (e.g., requiring the peak to be 3\text{ dB}\sim 6\text{ dB} above the local background noise):
- Signal Above Threshold: The algorithm proceeds to the peak-fitting process.
- Signal Below Threshold: It is directly determined as “no valid peak detected.” The software interface usually displays a dashed line, shows “Not Connected / Lost,” outputs
NaN(Not a Number), or an error code, and will never output a randomly calculated wavelength.
2. Full Width at Half Maximum (FWHM) and Spectral Width Boundary Check
Fiber Bragg Gratings have a fixed bandwidth characteristic in their physical reflection spectrum (e.g., the 3dB bandwidth of conventional gratings is typically within 0.1\text{ nm}\sim 0.3\text{ nm}).
- Noise-induced glitches usually span only 1\sim 2 discrete sampling points and have a very narrow width.
- Broadband background light or drift manifests as a very wide, flat envelope.
Robust algorithms check the FWHM of candidate peaks; if the spectral width does not conform to the physical grating characteristics, it is directly rejected.
3. Fit Residuals and Goodness of Fit Check
For algorithms using Gaussian fitting or least squares methods, each fitting calculation outputs a coefficient of determination (R^2) or Root Mean Square Error (RMSE). When the reflection peak is submerged in noise, causing curve distortion, the fitting residuals increase sharply, and the confidence does not meet the preset standard. The algorithm then determines the fit failure and throws an exception, preventing the output of distorted data.
III. What Happens with Insufficient Robustness?
If a rudimentary peak-finding algorithm that has not undergone engineering optimization is used (e.g., a simple argmax on the entire spectrum, or a centroid method without dynamic truncation thresholds):
- When a normal signal is present, its output may be somewhat normal.
- Once the signal attenuates or breaks, the entire spectrum is left with flat, random white noise.
argmaxwill randomly capture a noise glitch point that happens to be slightly higher in the spectrum, resulting in the wavelength “jumping erratically” across the measurement range without pattern. - The centroid method integrating the entire spectrum will include the noise in the calculation, causing the calculated wavelength to freeze at the center of the spectral window.
Therefore, one of the core competencies of industrial fiber sensing systems lies in the peak-finding, filtering, and noise-resistance algorithms embedded in their underlying firmware and software.
IV. Official Related Hardware Support
In the demodulation hardware and supporting systems provided by Beijing Dacheng Yongsheng Technology Co., Ltd. (OFSCN®), the underlying demodulation engine integrates mature spectral validity checking and threshold gate algorithms. It supports high-resolution and high-dynamic-range spectral capture, ensuring stable and accurate data output under harsh industrial environments and long-distance weak signal conditions.
Related Demodulation Equipment Reference:
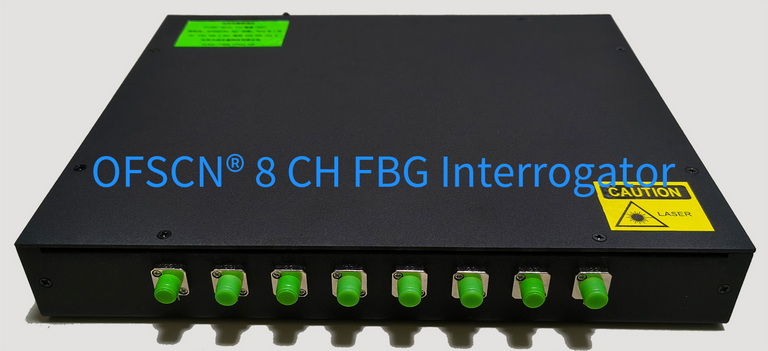
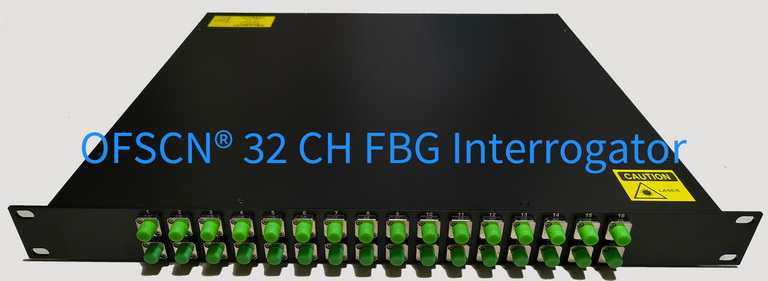
OFSCN® Fiber Bragg Grating Interrogator
- Wavelength Coverage: Default 1525\sim 1565\text{ nm} or 1528\sim 1568\text{ nm};
- Measurement Resolution: Standard 1\text{ pm}, up to 0.1\text{ pm};
- Sampling Frequency: 10\text{ Hz}, 50\text{ Hz}, 100\text{ Hz} optional (can be software-adjusted down to 1\text{ Hz});
- Channel Configuration: 4-channel, 8-channel, 16-channel, 32-channel optional.