Why does the signal I see on the screen look like a “small mountain peak”? What does the peak represent?
On the display interface of Fiber Bragg Grating (FBG) sensing and measurement systems (such as spectrometers or FBG demodulators), the presented “spectrum diagram” is essentially an energy distribution map of optical power versus wavelength.
I. Definition of Spectrum Diagram Axes
- Abscissa (X-axis): Represents the Wavelength of light, commonly measured in nanometers (\text{nm}) or picometers (\text{pm}) in engineering practice. The common monitoring bands for demodulation systems typically fall within the near-infrared C-band (e.g., 1525\ \text{nm} \sim 1565\ \text{nm}).
- Ordinate (Y-axis): Represents the Reflected Optical Power or Relative Reflectivity at a specific wavelength, commonly expressed in logarithmic decibel-milliwatts (\text{dBm}) or linear percentage (\%) in engineering practice.
II. Why Does the Signal Resemble a “Small Mountain Peak”?
This “small mountain peak” shape is known as the narrow-band Reflection Spectrum of a Fiber Bragg Grating. The physical mechanisms generating this morphology are as follows:
- Narrow-band Filtering and Phase Matching: The refractive index within the core of the FBG exhibits microscopic periodic modulation (grating period is \Lambda ). When broadband light is injected into the fiber, only wavelengths that satisfy the Bragg coherent scattering condition will have their reflected waves from each periodic interface constructively interfere (reinforce), leading to strong reflection. Wavelengths that do not meet this condition will pass through with almost no loss.
- Finite Bandwidth and Envelope Shaping: Due to the finite length of the grating region (typically 2\ \text{mm} \sim 10\ \text{mm}), phase matching results in a localized region of energy broadening. This causes the reflection not to be an infinitely narrow ideal pulse, but rather a continuous envelope with a specific spectral width (e.g., a typical 3\ \text{dB} bandwidth of about 0.2\ \text{nm} \sim 0.4\ \text{nm}).
- Side Mode Suppression: In regions far from the coherently matched wavelength, optical power rapidly attenuates and drops to the system’s noise floor (typical grating Side Mode Suppression Ratio (SMSR) \ge 15\ \text{dB} ). Consequently, the energy curve, strong in the center and steeply declining on the sides, visually presents as an independent “small mountain peak” on the screen.
III. What Does the “Peak Tip” Represent?
The highest peak tip (Peak) of this “small mountain peak” is the core physical reference point for the entire FBG sensing system:
- The Abscissa Corresponding to the Peak Tip — Center Wavelength (Bragg Wavelength, \lambda_B )
- According to the Bragg reflection equation:\lambda_B = 2 n_{\text{eff}} \Lambdawhere n_{\text{eff}} is the effective refractive index of the fiber core, and \Lambda is the grating modulation period.
- Core Sensing Physical Quantity: When external environmental factors like temperature or mechanical strain (stretching/compression) change, the fiber’s photoelastic, thermo-optic, and thermal expansion effects cause minor changes in n_{\text{eff}} and \Lambda . This, in turn, leads to a leftward shift (blue shift) or rightward shift (red shift) of the peak tip on the abscissa. By real-time tracking of the peak tip’s wavelength drift ( \Delta \lambda_B ), the measured temperature or strain values can be inversely calculated.
- According to the Bragg reflection equation:
- The Ordinate Corresponding to the Peak Tip — Peak Reflection Power
- Reflects the maximum reflection intensity of the grating and the optical loss status of the return link.
IV. How Demodulators Process “Mountain Peak” Signals
The high-speed acquisition modules and firmware algorithms (such as Gaussian fitting algorithms, centroid algorithms, etc.) embedded in FBG demodulators continuously scan and fit this reflection spectrum “small mountain peak” to lock onto the center wavelength corresponding to the peak tip in extremely short periods.
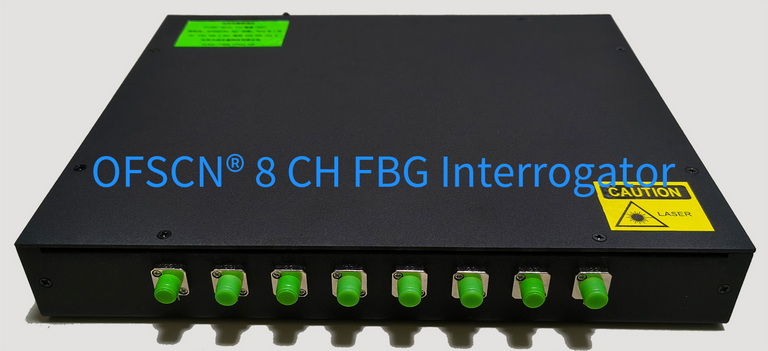
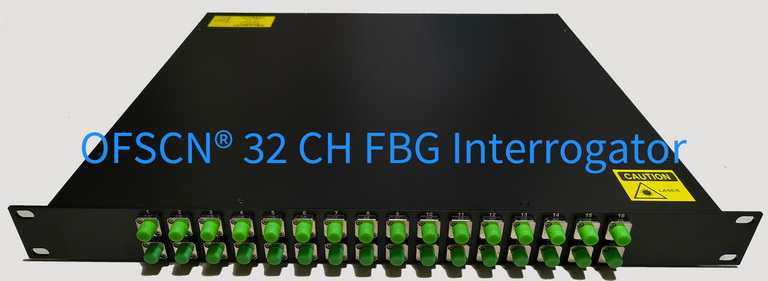
Within Beijing Dacheng Yongsheng Technology Co., Ltd.'s (OFSCN®) product line, the specialized core equipment for capturing, demodulating, and displaying this spectral signal is the OFSCN® Fiber Bragg Grating Interrogator. This equipment offers wavelength resolutions of 1\ \text{pm} or 0.1\ \text{pm}, supporting multi-channel parallel high-speed acquisition and spectral reconstruction.