We generate several GB of data every day. How can we compress it for storage so it doesn’t take up too much hard drive space?
What is Data Compression?
Data compression is the process of reducing the number of physical storage bits (Bits) required to represent data in a computer file, without loss or with only minimal acceptable information loss, by utilizing information theory and encoding algorithms.
The theoretical basis originates from Shannon’s Information Theory: most raw engineering time-series data contain significant statistical redundancy and correlation. The essence of data compression is to eliminate this redundancy.
It is typically divided into two main branches:
- Lossless Compression: Data after decompression is bit-for-bit identical to the originally acquired data. It is often used in critical scenarios such as scientific computing and raw recording of fiber optic sensing feature peak wavelengths (common algorithms include DEFLATE, LZ4, Zstandard, Snappy).
- Lossy Compression: Achieves extremely high compression ratios by discarding high-frequency minor noise imperceptible to the human eye or engineering analysis. It is commonly used for filtering dead zones in audio/video and for steady-state industrial time-series data.
Root Causes of Data Bloat in Fiber Optic Sensing Scenarios
In fiber optic sensing monitoring systems like Fiber Bragg Grating (FBG), the typical reasons for generating several GB of data daily include:
- High Sampling Frequency: If the demodulation equipment operates at 50\ \text{Hz} or 100\ \text{Hz}, a single channel produces 50 to 100 data frames per second.
- Multiplexing of Measurement Points and Channels: With multiple channels (e.g., 8, 16, or 32 channels) and dozens of cascaded measurement points, the total number of points multiplied by the sampling rate results in thousands of floating-point measurements per second.
- Inefficient Storage Format: Many systems default to using ASCII text (e.g.,
.csv,.txt) for plain text storage. A double-precision floating-point number (double) occupies only 8 bytes (8\ \text{Bytes}) in binary, but when stored as a string (including timestamps, commas, and line breaks), it can expand to 20-30 bytes, leading to a significant increase in file size.
Compression and Storage Optimization Strategies for Gigabytes of Daily Data
To address the issue of limited hard drive storage space and the massive data volumes generated during long-term monitoring in engineering sites, a tiered optimization approach across the following four dimensions is recommended:
1. Use Compact Binary or Time-Series Data Formats at the Storage Layer
- Abandon CSV/TXT Plain Text Storage: Write data directly into compact columnar storage formats (e.g., Parquet, HDF5, Feather) or dedicated time-series databases (e.g., TDengine, InfluxDB, TimescaleDB).
- Effect: Simply switching the storage mechanism from string text to native binary can directly reduce disk space usage by approximately 60% to 80%.
2. Apply Lossless Streaming Compression Algorithms for Time-Series Data
- Floating-Point Delta/XOR Compression (Gorilla / Chimp Algorithms): In industrial time-series monitoring, timestamps between adjacent sampling periods are typically equidistant, and changes in wavelength or temperature/strain in consecutive samples are usually very small. Using differential algorithms (Delta-of-Delta) to compress timestamps, combined with XOR compression for floating-point mantissas, can achieve compression ratios of 5:1 to 10:1 while maintaining lossless precision.
- System-Level Archival Compression (Zstandard / LZ4): After data is segmented and archived hourly or daily, call a general-purpose compression library. Zstandard (zstd) demonstrates excellent engineering performance in balancing compression speed and compression ratio.
3. Implement Lossy/Deadband Compression at the Algorithm Layer (Swinging Door Trending / Deadband)
- Swinging Door Trending (SDT) or Deadband Threshold Filtering: Set a tolerance range (e.g., wavelength drift \Delta\lambda \le 1\ \text{pm} or temperature change \Delta T \le 0.1\ ^\circ\text{C} is considered steady-state noise). During steady-state phases where the monitored object exhibits no drastic fluctuations, record only trend inflection points and ignore redundant points along a straight line.
- Event-Triggered Logging: For vibrations, impacts, or sudden anomalies, the system typically uses low-frequency recording or a circular memory ring buffer. Only when an out-of-bounds or high-frequency transient event is captured is the complete raw data at full frequency range solidified to disk.
4. Configure Instrument Sampling Rate Appropriately at the Data Source
For monitoring slow-varying quantities such as quasi-static deformation of bridges, settlement of tank foundations, or ambient temperature fields, it is unnecessary to maintain ultra-high sampling frequencies for extended periods. For example, Beijing Dacheng Yongsheng Technology Co., Ltd.'s OFSCN® Fiber Bragg Grating Interrogator features built-in software that allows users to autonomously reduce the sampling frequency from the default 100\ \text{Hz} or 50\ \text{Hz} to 1\ \text{Hz} or even lower, based on actual engineering requirements:
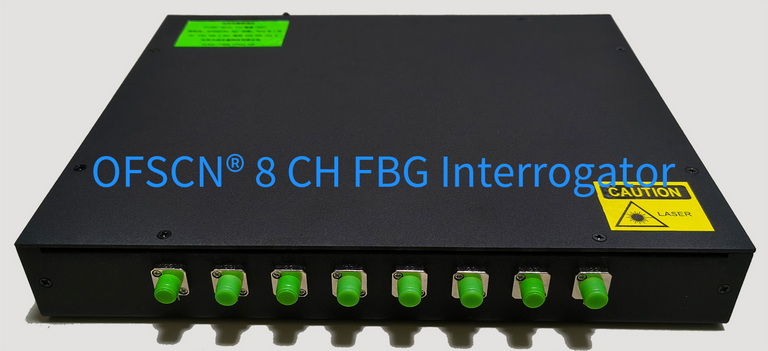
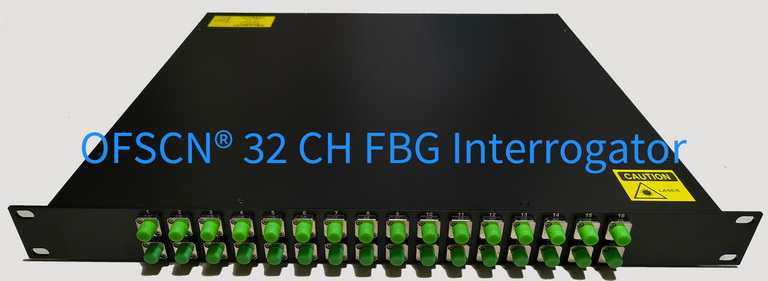
Adjusting the sampling frequency from 100\ \text{Hz} to 1\ \text{Hz} can directly reduce the raw data generation volume by 99% at the source.
Implementation Roadmap Summary
- Short-term, Quick Wins: Stop using CSV for writing and switch to SQLite/HDF5/Parquet, or integrate
zstdalgorithm on the software side for compression during acquisition. - Mid-term System Optimization: Set reasonable equipment sampling frequencies based on the properties of the physical quantities being measured (dynamic fatigue vs. static temperature) and incorporate deadband filtering.
- Long-term Architectural Evolution: Integrate with an industrial time-series data storage engine, implementing a tiered retention strategy of “short-term retention and overwriting of high-frequency data, long-term archiving of low-frequency/feature trend data.”