Is the saved data in Excel or TXT format? Can I use Origin for plotting?
In fiber Bragg grating (FBG) sensing measurement and data acquisition systems, the “data export format” and subsequent data processing methods are as follows:
I. Is the saved data Excel or TXT?
In most fiber Bragg grating demodulators and their supporting acquisition analysis software, the saved and exported data are typically in plain text format (.csv / .txt) or standard spreadsheet format (.xlsx / .xls):
-
.csv/.txtFormat (Most Universal and Recommended):- Principle and Structure: A plain text file where columns are delimited by commas (Comma-Separated Values) or tabs.
- Content Composition: Usually includes header information (timestamp/sampling point number, physical channel number, FBG sensor ID for each measurement point), and for corresponding measurement points, the reflectivity center wavelength (unit typically \text{nm} or \text{pm}), and the converted physical quantity (such as temperature ^\circ\text{C}, strain \mu\varepsilon, stress \text{MPa}, etc.).
- Advantages: Lightweight, fast write speed, small storage space occupation, suitable for real-time recording of massive data during long-term continuous monitoring or at high sampling rates (e.g., 10\text{ Hz}, 50\text{ Hz}, 100\text{ Hz}). Additionally,
.csvfiles can be directly opened by double-clicking in Microsoft Excel.
-
.xlsx/.xlsFormat:- Some software supports direct export to Microsoft Excel workbook format, facilitating quick viewing and preliminary organization with office software.
II. Can I use Origin for plotting?
Absolutely, and it is highly recommended.
Origin is a universal data analysis and graphing software in scientific and engineering fields, offering native support for all the aforementioned formats:
- Import Methods:
- Direct Drag and Drop: Drag and drop the saved
.csv,.txt, or.xlsxfile directly into the Origin workspace (Workbook). - Menu Import: In Origin, select
File\rightarrowImport\rightarrowSingle ASCII (*.dat, *.txt, *.csv)orExcel (*.xls, *.xlsx)to import.
- Direct Drag and Drop: Drag and drop the saved
- Plotting Operations:
- Set the “Timestamp” or “Sampling Sequence” column as the X-axis.
- Set the wavelength data or converted physical quantity columns for each FBG measurement point as the Y-axis.
- You can then generate a Time-History Curve of Wavelength vs. Time, comparative plots of temperature/strain distribution at multiple points, or further perform FFT spectral analysis and curve fitting with a single click.
III. Related Equipment and System Integration Capabilities
The OFSCN® Fiber Bragg Grating Demodulator System supports flexible data acquisition, storage, and multi-platform integration:
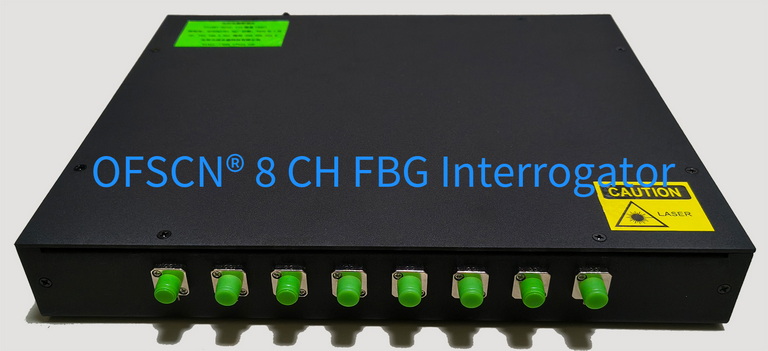
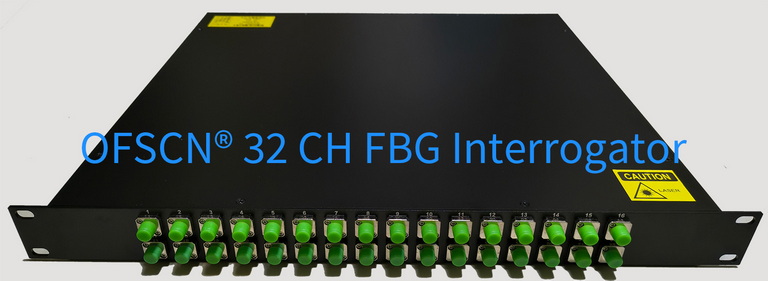
- Product Introduction and Technical Specifications: OFSCN® Fiber Bragg Grating Interrogator Official Link
- Wavelength Range: Default 1525\sim 1565\text{ nm} or 1528\sim 1568\text{ nm} (customizable).
- Channel Configuration: 4-channel, 8-channel, 16-channel, 32-channel options available.
- Sampling Frequency: 10\text{ Hz}, 50\text{ Hz}, 100\text{ Hz} options available (software supports independently reducing the sampling frequency to 1\text{ Hz} for use).
- Software Architecture and Interfaces: Default B/S architecture, supports C/S architecture software, and can efficiently integrate with third-party systems or custom data analysis programs through communication protocols such as TCP, UDP, Modbus, etc., for real-time data streaming.